10/5/23
AIM
FIG 7
−
3
−
1
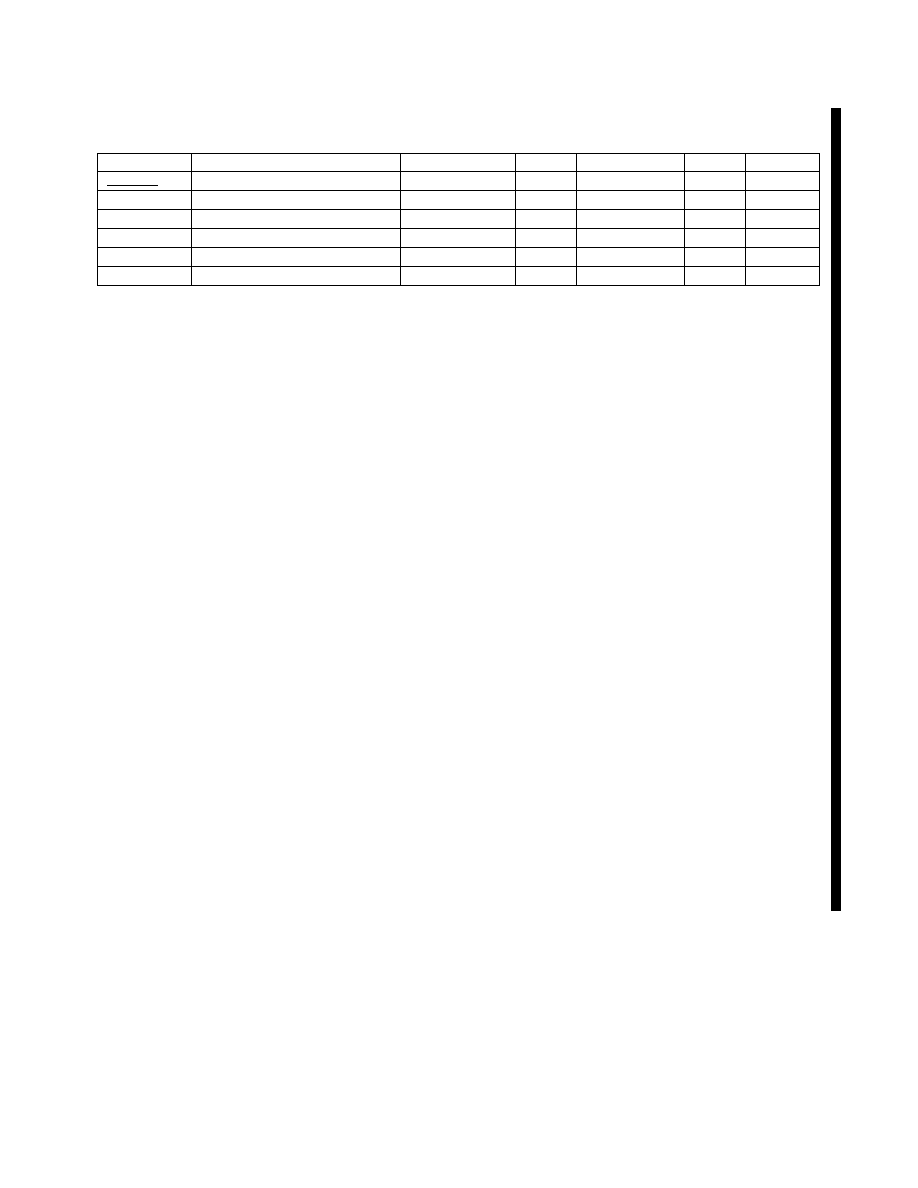
Example Cold Temperature Restricted Airport List
−
Required Segments
Identifier
Airport name
Temperature
Initial
Intermediate
Final
Missed
Montana
KBTM
Bert Mooney
−
25C
X
X
X
KBZN
Bozeman Yellowstone Intl
−
31C
X
KEKS
Ennis Big Sky
−
25C
X
KGPI
Glacier Park Intl
−
15C
X
KHLN
Helena Rgnl
−
17C
X
X
X
(a)
Manual Correction: Pilots will make a manual correction when the aircraft is not equipped with a
temperature compensating system or when a compensating system is not used to make the correction. Use
1, ICAO Cold Temperature Error Table, to calculate the correction needed for the approach
segment(s).
(1)
Initial Segment: All altitudes from the intermediate fix (IF) altitude up to and including the IAF
altitude. The correction may be accomplished by using the IF altitude or by using the All Segments Method (a)
Manual correction (1). To correct the initial segment by using the IF altitude, subtract the airport elevation from
the IF altitude. Use this number to enter the height above airport column in TBL 7
temperature from the “Reported Temperature” row. Round this number as applicable and then add to the IF, IAF,
and any step-down fix altitudes.
(2)
Intermediate Segment: All altitudes from the FAF/PFAF up to but not including the IF altitude.
Calculate the correction by taking FAF/PFAF altitude and subtracting the airport elevation. Use this number to
enter the height above airport column in TBL 7
1 until reaching the reported temperature from the “Reported
Temperature” row. Round this number as applicable and then add to FAF altitude and all step-down fix altitudes
within the intermediate segment (inside of the waypoint labeled “IF”).
(3)
Final segment: Calculate the correction by taking the MDA or DA for the approach flown and
subtract the airport elevation. Use this number to enter the height above airport column in TBL 7
1 until
reaching the reported temperature from the “Reported Temperature” row. Use this number or round up to next
nearest 100 ft. Add this number to MDA or DA and any applicable step-down fix altitudes in the final segment.
(4)
Missed Approach Segment: Calculate the correction by taking the final MA holding altitude and
subtract the airport elevation. Use this number to enter the height above airport column in TBL 7
1 until
reaching the reported temperature from the “Reported Temperature” row. Round this number as applicable and
then add to the final MA altitude only.
(b)
Aircraft with temperature compensating system: If flying an aircraft equipped with a system capable
of temperature compensation, follow the instructions for applying temperature compensation provided in the
AFM, AFM supplement, or system operating manual. Ensure the temperature compensation system is on and
active prior to the segment(s) being corrected. Manually calculate an altimetry correction for the MDA or DA.
Determine an altimetry correction from the ICAO table based on the reported airport temperature and the height
difference between the MDA or DA, as applicable, and the airport elevation, or use the compensating system
to calculate a temperature corrected altitude for the published MDA or DA if able.
g.
Communication: Pilots must request approval from ATC whenever applying a cold temperature altitude
correction. Pilots do not need to inform ATC of the final approach segment correction (i.e., new MDA or DA).
This request should be made on initial radio contact with the ATC facility issuing the approach clearance. ATC
requires this information in order to ensure appropriate vertical separation between known traffic. Pilots should
query ATC when vectored altitudes to a segment are lower than the requested corrected altitude. Pilots are
encouraged to self
−
announce corrected altitude when flying into a non
−
towered airfield.
1.
The following are examples of appropriate pilot
−
to
−
ATC communication when applying
cold
−
temperature altitude corrections.
Cold Temperature Barometric Altimeter Errors, Setting Procedures and Cold Temperature
7
−
3
−
5
Airports (CTA)